
In every industry, reports are essential. Every CEO or COO wants to see the progress of their company every month, quarter or year. There are different ways to make a report. One can do it through charts, pies or tables. Many tools can be used in making them and one of it is Power BI Desktop.
Power BI is a free application of Microsoft used for business analytics solution. It helps you visualize your data and share it across your organization or put them in your app or website. You can share your reports using the Power BI service. You can bring your data to life with live dashboards and reports. It gives you the best feature of having an auto refresh for your data without having a user to update it every day.
Power BI Desktop can create complex and visually rich reports that sometimes other applications can’t do. One example is the connection of data. You can connect to multiple data sources. But how can one connect to the data which is the first step in making the reports?
Getting started with Power BI desktop
To start working with Power BI desktop, first you need to download and install the application. There are two ways to get it:
Step 1 . Download Power BI desktop from the web
Step 2 . Get it from the Windows store
Once you have installed the tool, you can now start on working with it.
Connect to Data
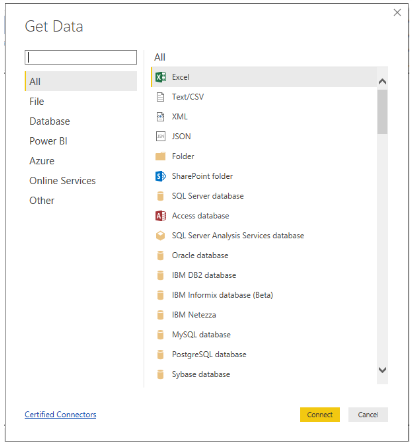
There are many different sources that you can connect to from Power BI desktop. To connect to a data source, first select the Home button, then after select Get Data > More. Below is an image that shows the Get Data window, it shows all the categories to which Power BI Desktop can connect
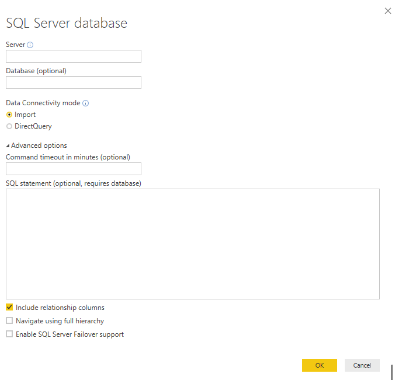
When you select the type of data, you’re prompted for information, such as the URL and credentials, needed for Power BI Desktop to connect to the data source on your behalf. Below is an example if you of information needed if you want to connect to an SQL Server database.
When you’re already connected to one or more data sources, you may want to transform the data so it’s useful for you.
Cleaning and Transforming Data
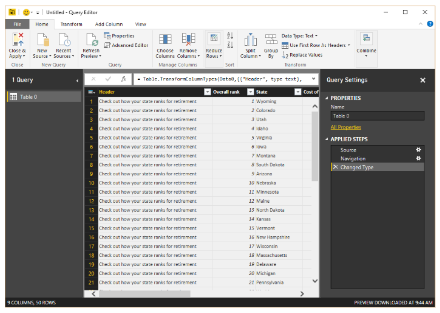
Using Power BI desktop, you can clean and transform data using the Query Editor. With it you can make changes to the data, like for example change the data type, remove columns or combine data from multiple sources. Below is an image of the Query Editor.
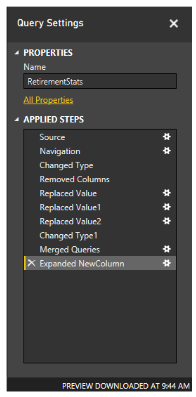
All your steps in transforming data is recorded by the Query Editor, so that each time the query connects to the data source those steps are carried out and the data is always shaped the way you specified. You can see below the image that shows the Query Settings pane for a query that has been modified.
Create visuals
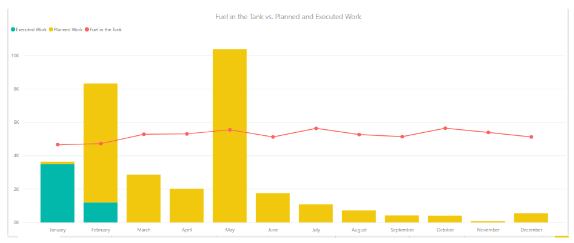
Once you’re done doing the changes for your data, you can now create visuals. You can drag fields onto the report canvas to create visuals. A visual is a graphic representation of the data in your model. The following image shows a sample of a visual.
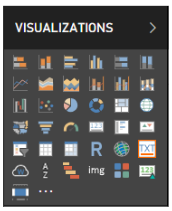
There are different types of visuals one can choose from in Power BI desktop. To create or change a visual, just select an icon from the Visualizations pane. If you have a visual selected on the report canvas, the selected visual changes to the type you selected. If no visual is selected, a new visual is created based on your selection. The following image is a sample of a Visualizations pane.
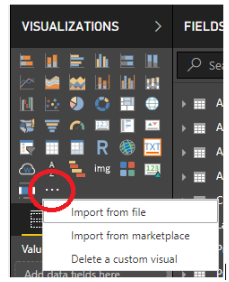
You can add more Visuals by importing them from a file or from the marketplace. You can also delete a custom visual. To add more visuals, click the ellipsis on the last part of the Visual icons. See image below.
How to create a visual
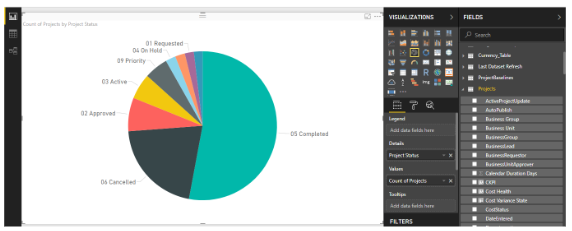
To create a visual, first you need to choose what type of visual you want. Then after you click it. In this example we will choose a simple pie chart that would contain count of projects by status.
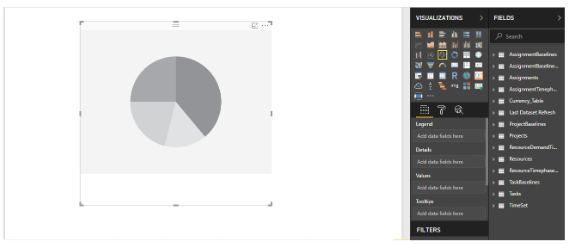
Once you have clicked the visual. Click the table where you want to pull the data from. Then look for the fields needed for the visual. In the example we are looking for the Project Name and Project Status. Below is the finished visual.
Create Reports
A collection of visuals in one Power BI desktop file is called a Report. Reports are what usually an office needs or wants. Just like your typical Excel report where there are multiple sheets, Power BI desktop report can also have one or more pages. Below is an example of a report that has multiple pages.
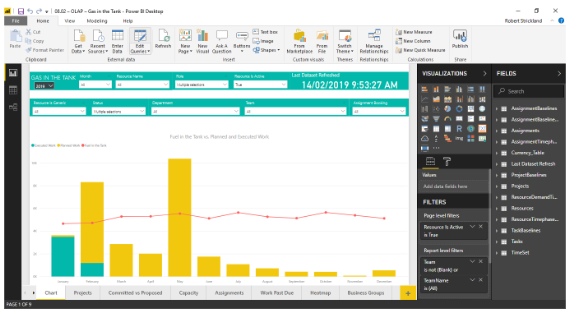
This report has 9 pages in total.
Share Reports
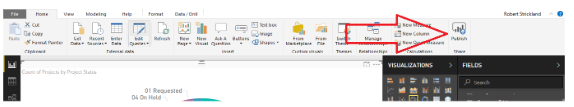
When your report is ready to share with others, you can Publish it to the Power BI service, and make it available to anyone in your organization who has a Power BI license. To publish your report, select the Publish button from the Home ribbon in Power BI desktop.
After clicking the Publish button, Power BI desktop will connect you to the service mentioned earlier using your Power BI account. But if you are already logged in, it will go to the next step which will be a window that will show you where in the service would you like to share the report, such as your workspace, a team workspace or some other location.
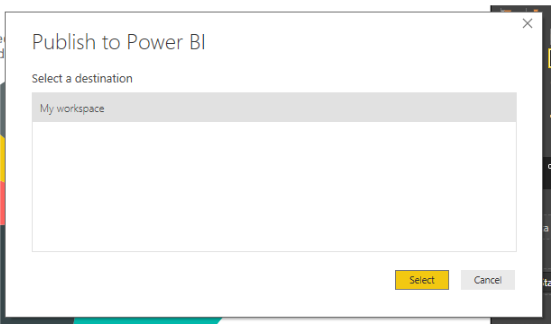
You must have the Power BI license for you to share the reports to the service.